


The Creative Class Group, founded by world renowned urbanist Richard Florida, is a global advisory firm composed of expert researchers, academics, and business strategists. Our proprietary data and research, gives companies and regions leading insights to achieve growth and prosperity.


Our Services

Data & Research
The Creative Class group provides communities, economic developers and real estate developers with the research and tools needed to implement competitive strategies for sustainable economic prosperity.

Consulting
Economic development, workshops, and corporate advising. CCG works with cities large and small to help empower leaders to achieve greater economic growth, inclusivity and sustainability.

Speakers
The Creative Class Group has convened the world’s best experts on creativity, business innovation, economic development and global trends.

covid CITIES
Providing guidance, insights and strategy to mayors, governors, and community leaders on economic recovery strategies.
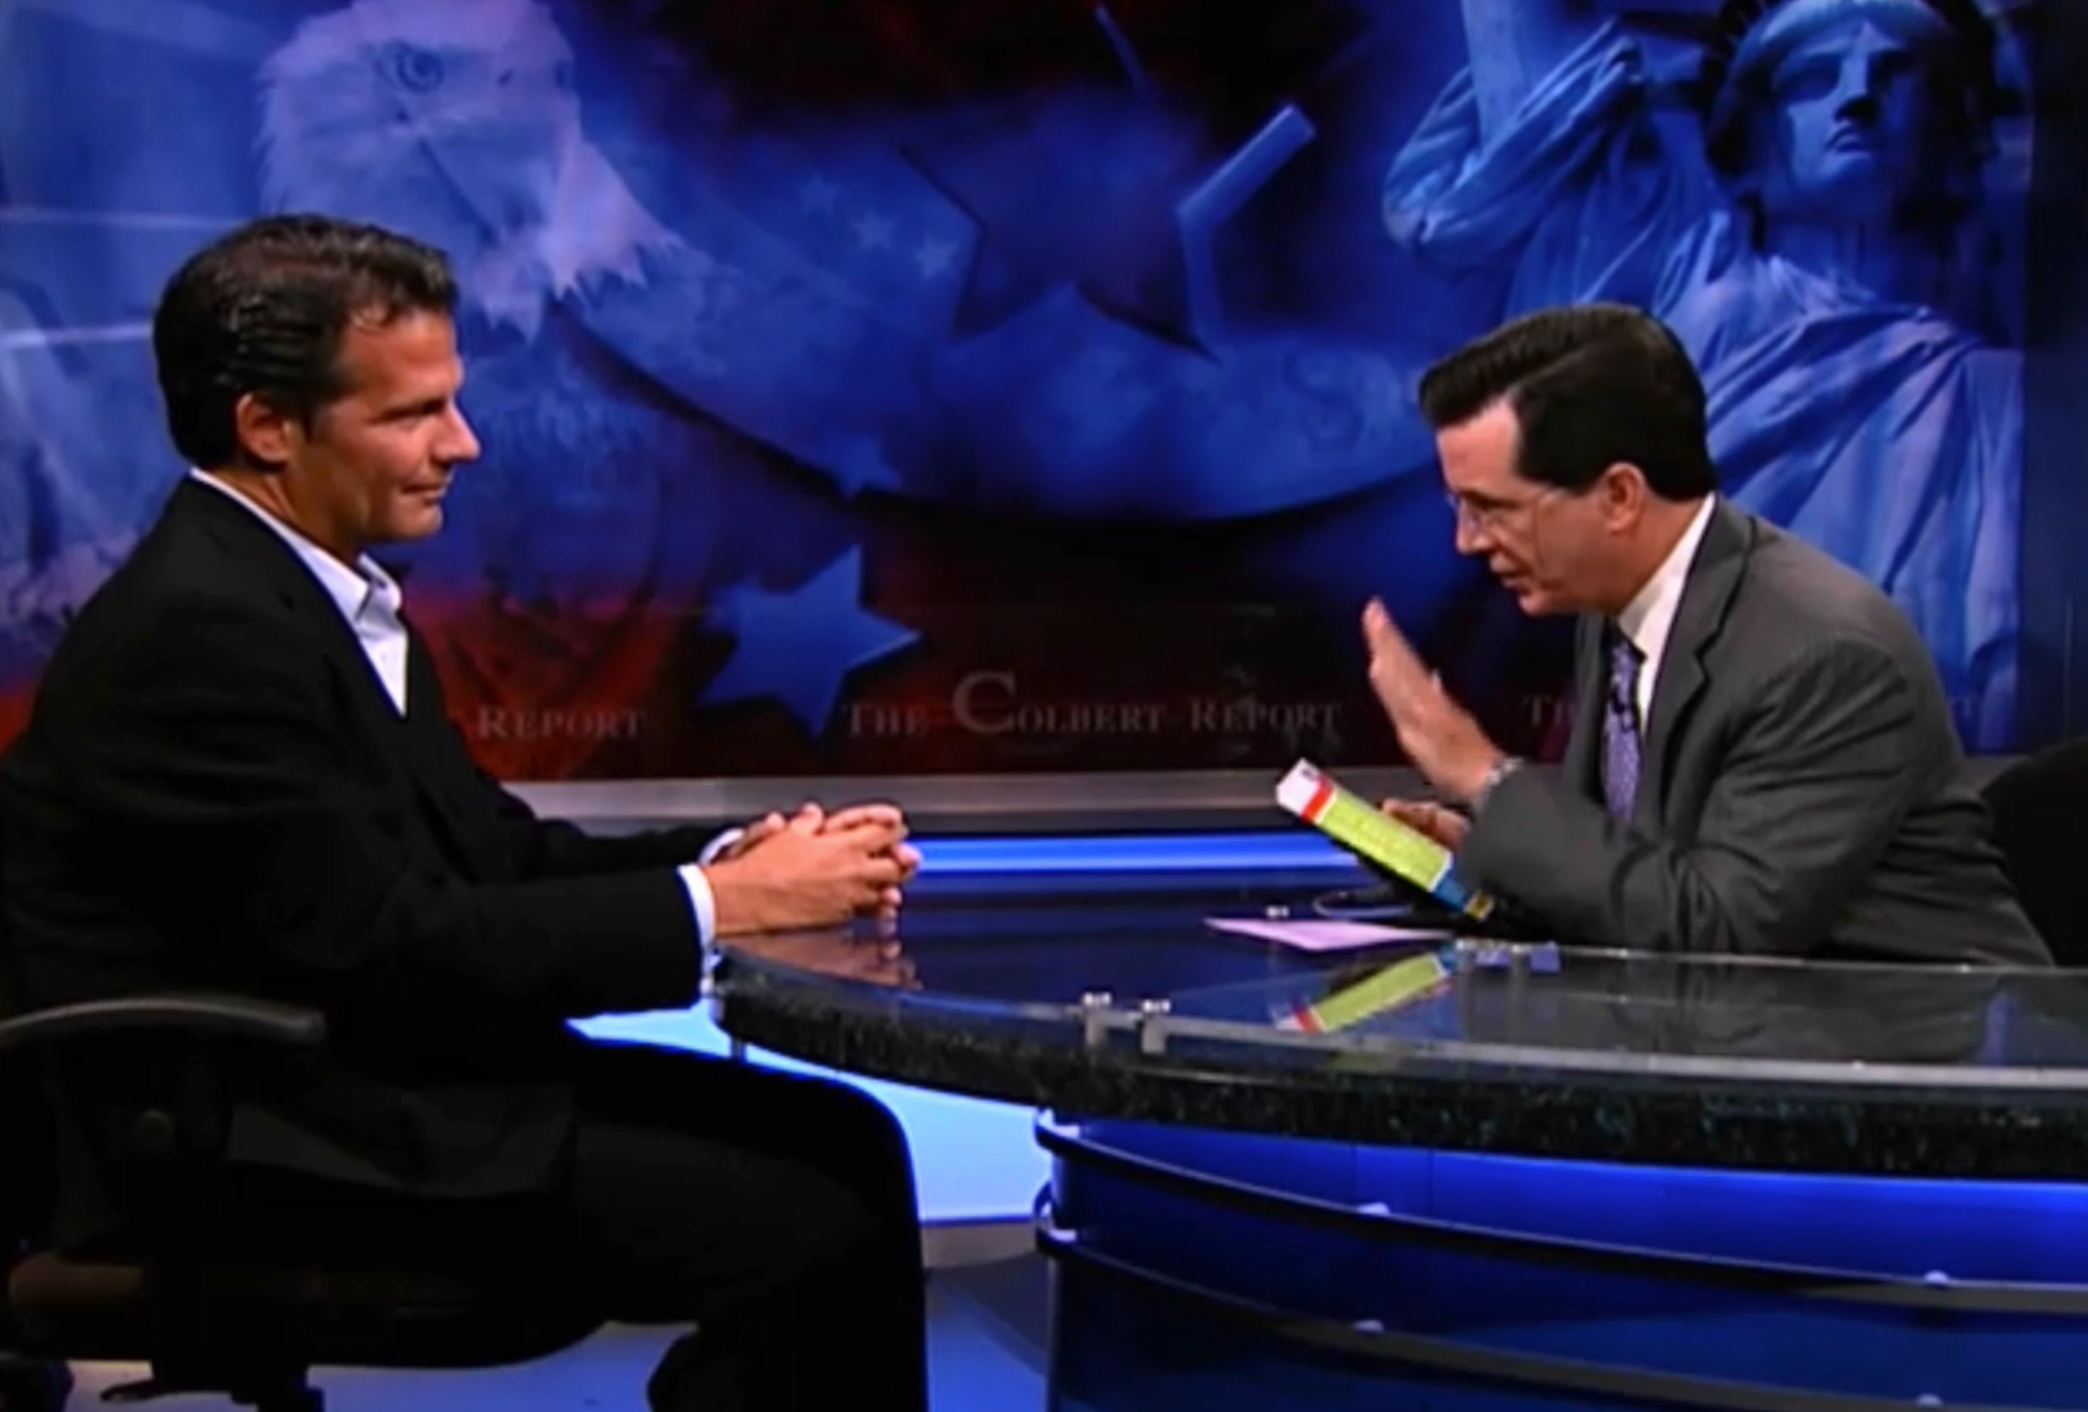
Richard Florida
Speaking
Richard Florida is one of the world’s leading urbanists. He is a researcher and professor, serving as University Professor at University of Toronto’s School of Cities and Rotman School of Management and a Distinguished Fellow at NYU and Florida International University.
Richard Florida’s
Online Course
Join Professor Richard Florida’s Global Cities Online Course! This free course will provide the knowledge and the tools needed to understand what cities do, why they matter, the forces shaping the greatest wave of urbanization in history, and how to pick the right place for you.


covidCITIES.com
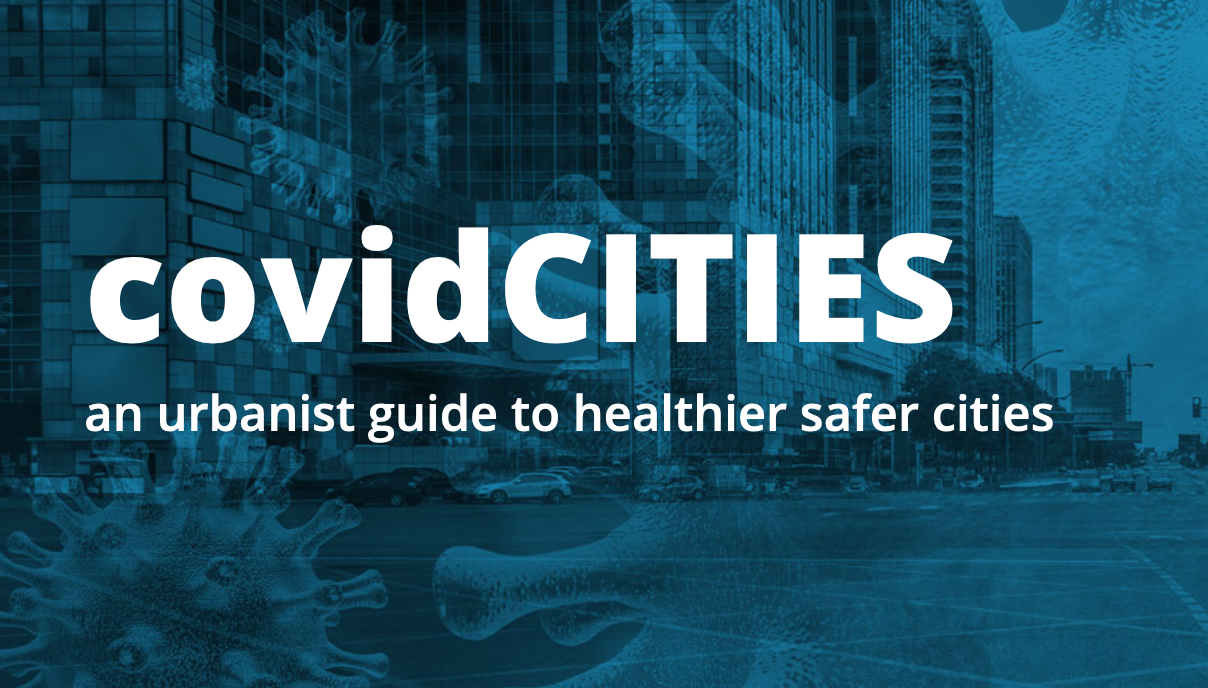
Providing guidance, insights and strategy to mayors, governors, and community leaders on economic recovery strategies.